Can you be sure there’s a difference?
Student’s T test is a frequent method scientists use to “prove something”. The logic of this test is difficult. Very few scientists understand it well. In particular they don’t understand that if the same experiment is done again and again in the same circumstances, each ma entirely different test result may be obtained.
Imagine we have two sets of measurements, one from a treated group and one from an untreated (control) group. To test if the treatment has an effect, the scientist says “let’s believe that there has been NO effect” (a null hypothesis). We imagine that the two sets of data could have come from the same population (think of a bag of barley grains, and we’ve taken two handfuls, at random, from the same bag). Naturally, in the bag there is likely to be a range of grain sizes, some small, most medium, some large. Each handful will have a range of grain sizes. The T test tells us how likely it could be that we had drawn our two samples from the same bag. If that is unlikely, then we have to conclude that they are unlikely to be the same: the “same bag” idea – the null hypothesis – is unlikely. This leads us to believe that our samples are different, and the treatment may be the reason.
We only have two handfuls (which we already know have come from differently treated plots). Each is a random sample from the experimental plot. We weigh each grain from each handful, work out the average weight of the grains, and also measure the variation in grain weights around this mean value. The average weights would almost always be a little different, even if they had come from the same bag, because by chance we are likely to have, for example, a few more large grains in one handful.
Knowing the way grain weights are likely to vary (the way most natural values are distributed) we estimate the theoretical properties of what the whole bag, assuming the samples were both from that bag. We can then calculate the possibility that we could have obtained our samples from this estimated theoretical bag. Is this probability is likely, or not? If it were 100% likely, we say the probability (P) is 1: and if it were very unlikely, say one chance in 1000, that we had obtained those handfuls from the same bag, then P would be 0.001. Strictly speaking, P summarises the possibilities that we would get results such as we have, or even more dissimilar, using samples from the same bag. Most scientists assume that if the probability that the samples are from the same bag is less than 5% (P is less than 0.05), then the null hypothesis is unlikely: they conclude they’ve found a difference. Then they write their paper, and say look what we’ve found!

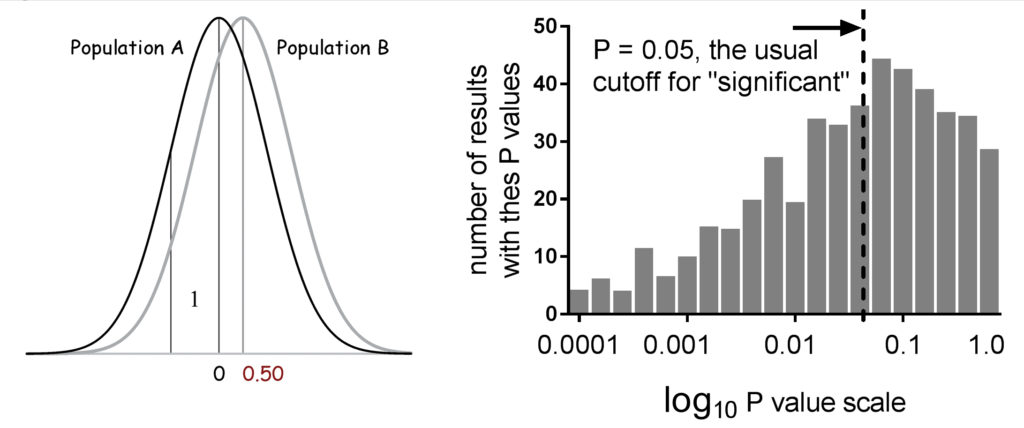
Fig. 1. Two populations, A and B: their means differ by 0.5 and the standard deviation of each is 1. Below are the results of 1000 T tests, done using repeated samples of 30 taken from these populations. Only half the P values are “significant”.
But: and it’s a big but – what if there IS a difference, and we can only take small samples? We did a simple experiment where we took two bags (“populations”) that were really different. We took repeated samples from these bags (replicate experiments). (Fig. 1) The P values we got were remarkably variable –random variation has a big effect. With small samples (often true for much of science), the test is unreliable. P is unreliable: a better strategy is estimate how confident we can be about the calculated mean values. Just using the P value, as many do, will lead to many wrong conclusions. Just now, science is finding that a whole lot of results cannot be replicated.
Gordon Drummond
Department of Anaesthesia Critical care and Pain Medicine
University of Edinburgh, United Kingdom
Publication
Most of the time, P is an unreliable marker, so we need no exact cut-off.
Drummond GB
Br J Anaesth. 2016 Jun


Leave a Reply
You must be logged in to post a comment.